 Volvenix
Nixtla vs IBM SPSS Forecasting
AI-enhanced independent comparison — features, pros, cons, pricing and rankings.
 ChatGPT
  Claude
  Gemini
  Midjourney
  DALL-E
  Stable Diffusion
  Notion AI
  Canva
Canva  Grammarly
  GitHub Copilot
  ElevenLabs
  Perplexity
  Runway
  Synthesia
  Fireflies.ai
  Hugging Face Hub

| Dimension | Nixtla | IBM SPSS Forecasting |
|---|---|---|
| Accuracy & Reliability | ||
| Ease of Use | ||
| Features & Capability | ||
| Value for Money | ||
| Performance & Speed | ||
| Popularity & Adoption |
Who each tool serves best — and when to pick the other one.
Data scientists and ML engineers who build custom forecasting pipelines using Python and prefer open-source tools.
- You build forecasting models using pandas and PyTorch in Python environments.
- You want open-source tools that integrate well with existing Python data workflows.
- Your team requires modular and extensible time series forecasting libraries.
Users seeking turnkey SaaS forecasting solutions or those without Python expertise should avoid this tool.
- You need a fully managed SaaS forecasting platform with minimal setup.
- Free-tier limits are a blocker for your production forecasting needs.
- You require a no-code or beginner-friendly forecasting solution.
Open-source Python libraries focused on modular, customizable time series forecasting pipelines.
Data analysts and business teams requiring reliable, automated time series forecasting for demand, supply, or risk management.
- You need to forecast demand or supply using historical time series data accurately.
- You want automated model selection to simplify complex forecasting workflows.
- Your team requires integration with IBM analytics platforms for end-to-end insights.
Users seeking modern UI/UX, transparent pricing, or lightweight forecasting tools for ad hoc analysis.
- You need a free, fully transparent pricing model for small-scale use.
- Free-tier limits are a blocker for experimenting with forecasting models.
- You require a modern, intuitive user interface for quick ad hoc forecasts.
Automated, statistically rigorous time series forecasting with integration into IBM analytics.
A canonical comparison across capabilities common to this category. Vendor-specific extras appear below in "Highlighted Features".
| Capability | Nixtla | IBM SPSS Forecasting |
|---|---|---|
|
Free Tier Available
Usable without payment (with usage limits)
|
✓ | ✓ |
|
Free Trial
Time-limited paid-plan trial
|
✓ | — |
Each tool's marketing-listed features. Where a feature appears under one tool but not the other, it usually reflects how the vendor describes their product — not a definitive capability gap.
- Open-source model — Access to multiple forecasting algorithms
- Time series forecasting — Multiple open-source forecasting models
- Python integration — Seamless use within Python data science workflows
- Feature engineering — Tools for time series feature extraction and transformation
- Evaluation & metrics — Built-in evaluation and backtesting tools
- Scalability — Designed to handle large time series datasets
- Integrations — Works seamlessly with pandas and PyTorch
- Cloud deployment — Hosted environment for running models
- Community Support — Access to forums and GitHub discussions
- Commercial Support — Optional paid support and services
- Automated Model Selection — Automatically selects best forecasting model based on data
- Multiple Forecasting Algorithms — Supports ARIMA, Exponential Smoothing, and more
- Scenario analysis — Enables what-if forecasting scenarios
- Integration with IBM SPSS Statistics — Seamless data exchange with IBM analytics tools
- Customizable Forecasting Models — Allows manual tuning of forecasting parameters
- Open-source with transparent, reproducible models
- Strong Python ecosystem integration
- Modular and extensible architecture
- Wide range of forecasting techniques supported
- Good integration with Python and data science tools
- Open-source with active development
- Includes feature engineering and evaluation
- Scalable for large datasets and production use
- Active community and growing documentation
- Supports multiple forecasting models
- Automated and customizable forecasting models
- Strong statistical and analytical foundation
- Integration with IBM SPSS Statistics
- Supports multiple forecasting scenarios
- Reliable for enterprise-grade forecasting
- No dedicated user interface for non-technical users
- Requires intermediate Python and ML skills
- Limited enterprise support and SLAs
- No managed SaaS platform available
- Limited official commercial support
- No official public API documented
- Pricing is not transparent and requires contact
- User interface is outdated compared to modern tools
- Building custom time series forecasting pipelines
- Forecasting sales and demand trends
- Predicting financial time series
- Feature engineering for time series data
- Energy consumption forecasting
- Evaluating forecasting model performance
- Research and experimentation with forecasting models
- Inventory and supply chain planning
- Integrating forecasting into Python data workflows
- Research and development of forecasting models
- Demand forecasting for retail and manufacturing
- Supply chain risk analytics
- Agricultural yield prediction
- Financial time series forecasting
- Inventory optimization
Natural languages each tool generates and understands. Primary languages are listed first.
What each tool can accept (input) and produce (output) — text, image, audio, video, code.
Free open-source libraries with optional paid services; core tools are free to use with no cost.
-
Free
Free -
Pro
popular
$20.00/mo -
Team
$30.00/mo
Offers a freemium model with limited features; full capabilities require paid licenses with pricing available upon request.
-
Free
Free
Regulatory frameworks each tool claims compliance with (HIPAA, SOC 2, GDPR, etc.).
Vendor-published numbers each tool highlights — usage scale, breadth, and operational stats. Different tools track different metrics, so direct row-by-row comparison usually isn't meaningful.
- Accuracy High forecasting accuracy
- Open-source libraries Free access
- Community support Active
- Forecast Accuracy High
Who each tool is positioned for — primary audience first.
How each tool is classified in the Volvenix catalog.
These vocabulary domains are managed in our catalog but not yet exposed at the tool level. We're tracking them for future expansion of this comparison.
- Encryption Types — AES-256, ChaCha20, RSA-2048, and similar at-rest/in-transit cipher families.
- Encryption Contexts — where encryption is applied (data at rest, in transit, end-to-end).
- Plan-tier Model Mapping — which AI models are available on which pricing tier (currently only the model list is tracked, not the per-plan availability).
- What is this tool?
- Nixtla is an open-source Python toolkit for time series forecasting, feature engineering, and evaluation.
- What is this tool?
- Nixtla (TimeGPT) is an open-source platform offering scalable time series forecasting models for data scientists.
- How much does it cost?
- Nixtla offers free open-source libraries with optional paid services for additional features and support.
- How much does it cost?
- Nixtla offers a free open-source tier; paid plans for enhanced features may be available.
- Does it have a free plan?
- Yes, the core libraries are free and open-source with community support.
- Does it have a free plan?
- Yes, the core forecasting models are available for free as open-source software.
- What integrations does it support?
- Nixtla integrates primarily with pandas and PyTorch in Python environments.
- What integrations does it support?
- It integrates primarily with Python data science tools and workflows.
- Who is it best for?
- It is best for data scientists and ML engineers building forecasting pipelines using Python.
- Who is it best for?
- It is best suited for data scientists and ML engineers needing customizable forecasting models.
- What is this tool?
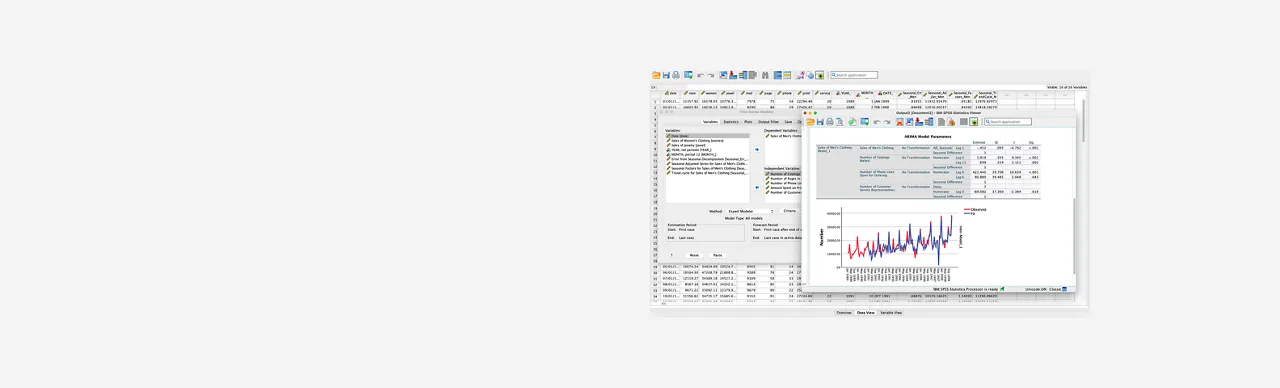
- IBM SPSS Forecasting is a software for time series forecasting and predictive analytics.
- How much does it cost?
- It offers a freemium model with limited features; full pricing requires contacting IBM sales.
- Does it have a free plan?
- Yes, a free plan with basic forecasting features is available.
- What integrations does it support?
- It integrates primarily with IBM SPSS Statistics and IBM analytics platforms.
- Who is it best for?
- Best suited for analysts and businesses needing automated, reliable time series forecasting.
Nixtla (TimeGPT), nixtla-timegpt
—
| Info | Nixtla | IBM SPSS Forecasting |
|---|---|---|
| Pricing | Freemium | Freemium |
| Category | Machine Learning Models & Algorithms | Agriculture & AgTech AI |
| Deployment | Self-hosted | Desktop |
| Learning Curve | Advanced | Intermediate |
| Free Plan | ✓ | ✓ |
| AI Agent | ✓ | ✗ |
| Autonomy | Assistant | Assistant |
| Risk Tier | Medium | Low |
| BYO API Key | ✗ | — |
| Local Models | ✗ | — |
| Fine-tuning | ✗ | — |
 Amazon Forecast
 SatSure Agri
 K Score
 Kayrros Agriculture Insights
 TrendMiner
 Neuron Soundware
 GMDH Shell
Nixtla and IBM SPSS Forecasting have similar overall scores, 5.4/10 and 5.5/10 respectively, and both offer freemium pricing models. Nixtla is typically favored for open-source time series forecasting with a focus on machine learning integration, making it suitable for data scientists and developers seeking customizable solutions. IBM SPSS Forecasting, on the other hand, provides a more traditional statistical forecasting approach with a user-friendly interface aimed at business analysts and enterprises requiring robust, automated forecasting workflows.
ⓘ How Volvenix scores work
Scores are computed by Volvenix — not supplied by the vendors, and not third-party benchmark results. Each 0–10 dimension (Overall, Features, Usability, Support, Pricing) is a directional estimate aggregated from catalog signals — editorial cataloguing, content depth, engagement, and provider-reputation indicators — so treat them as a starting point, not a lab result.
Confidence reflects how complete the underlying data is for both tools; lower confidence means fewer signals were available, not a worse tool. We never accept payment for rankings or scores. More about how Volvenix works →