K Score vs GMDH Shell
AI-enhanced independent comparison — features, pros, cons, pricing and rankings.
| Dimension | K Score | GMDH Shell |
|---|---|---|
| Accuracy & Reliability | — | |
| Ease of Use | — | |
| Features & Capability | — | |
| Value for Money | — | |
| Performance & Speed | — | |
| Popularity & Adoption | — |
Who each tool serves best — and when to pick the other one.
Individual investors and traders who want AI-based quantitative stock scores to enhance market analysis.
- You want to incorporate quantitative AI scores into your stock analysis workflow.
- You need a tool that synthesizes multiple financial data sources into one actionable score.
- Your investment strategy benefits from predictive analytics on stock trends.
Casual investors who prefer simple tools or users needing extensive API access and integrations.
- You need a fully integrated trading platform with order execution capabilities.
- Free-tier limits are a blocker for your data analysis needs beyond basic scoring.
- You require extensive API access or third-party integrations for automation.
The accuracy and reliability of its AI-driven stock scoring system.
Analysts and data scientists who need automated time series forecasting without coding, working primarily on desktop environments.
- You want to quickly generate forecasting models from historical data without coding.
- You need a desktop tool focused on time series predictive analytics.
- Your team requires automated model selection to speed up forecasting workflows.
Users requiring extensive API integrations, cloud-based collaboration, or advanced customization should consider other tools.
- You need cloud-based collaboration and real-time multi-user access.
- Free-tier limits are a blocker for your data volume or feature needs.
- You require API access to integrate forecasting into other systems.
Automated model building for time series forecasting without programming.
A canonical comparison across capabilities common to this category. Vendor-specific extras appear below in "Highlighted Features".
| Capability | K Score | GMDH Shell |
|---|---|---|
|
Free Tier Available
Usable without payment (with usage limits)
|
✓ | ✓ |
Each tool's marketing-listed features. Where a feature appears under one tool but not the other, it usually reflects how the vendor describes their product — not a definitive capability gap.
- Quantitative Stock Scoring — Generates predictive scores based on financial data
- Multi-Source Data Integration — Combines various financial and market data sources
- Trend Forecasting — Predicts potential stock price movements
- Alerts and notifications — Custom alerts on stock score changes
- Historical data analysis — Access to past stock score trends
- Automated Model Building — Self-organizing algorithms create forecasting models automatically
- Multiple Forecasting Techniques — Supports various time series forecasting methods
- Data Import — Import historical data from CSV and Excel files
- Advanced analytics — Provides predictive analytics and error metrics
- Batch processing — Run multiple forecasting tasks in batch mode
- Integrates diverse financial data for comprehensive scoring
- Clear, actionable stock trend predictions
- Suitable for quantitative investors
- Accessible free tier for basic use
- Focused on investment decision support
- Automates forecasting model creation
- Easy to use for non-programmers
- Supports multiple forecasting algorithms
- Desktop application for offline use
- Reduces manual effort in model tuning
- No public API for automation
- Limited mobile or desktop app availability
- Pricing details for paid plans are not fully transparent
- No API for external integrations
- Limited collaboration and sharing features
- Stock trend prediction for active traders
- Quantitative investment research
- Portfolio risk assessment
- Market opportunity identification
- Supplemental data for financial advisors
- Sales forecasting from historical data
- Financial time series prediction
- Demand planning and inventory management
- Energy consumption forecasting
- Economic indicator analysis
Where each tool runs — web, mobile, desktop, browser extension, API.
Natural languages each tool generates and understands. Primary languages are listed first.
What each tool can accept (input) and produce (output) — text, image, audio, video, code.
Offers a free plan with basic features and paid subscriptions for advanced data and analytics.
-
Free
Free -
Pro
popular
Custom pricing
Offers a free plan with basic features and paid subscriptions for advanced capabilities and higher usage limits.
-
Free
Free
Third-party audits and certifications that verify security controls.
No certifications listed.
Vendor-published numbers each tool highlights — usage scale, breadth, and operational stats. Different tools track different metrics, so direct row-by-row comparison usually isn't meaningful.
- Predictive Accuracy High
- Forecast Accuracy High
Who each tool is positioned for — primary audience first.
How you can reach support — email, live chat, phone, community, docs.
- Documentation primary
- Email primary
How each tool is classified in the Volvenix catalog.
These vocabulary domains are managed in our catalog but not yet exposed at the tool level. We're tracking them for future expansion of this comparison.
- Encryption Types — AES-256, ChaCha20, RSA-2048, and similar at-rest/in-transit cipher families.
- Encryption Contexts — where encryption is applied (data at rest, in transit, end-to-end).
- Plan-tier Model Mapping — which AI models are available on which pricing tier (currently only the model list is tracked, not the per-plan availability).
- What is this tool?
- K Score is a machine learning tool that analyzes financial data to generate predictive stock scores.
- How much does it cost?
- K Score offers a free plan with basic features and paid subscriptions for advanced analytics.
- Does it have a free plan?
- Yes, there is a free plan providing access to basic stock scores.
- What integrations does it support?
- K Score currently does not offer public API or third-party integrations.
- Who is it best for?
- It is best suited for investors and traders who use quantitative data to guide stock decisions.
- What is this tool?
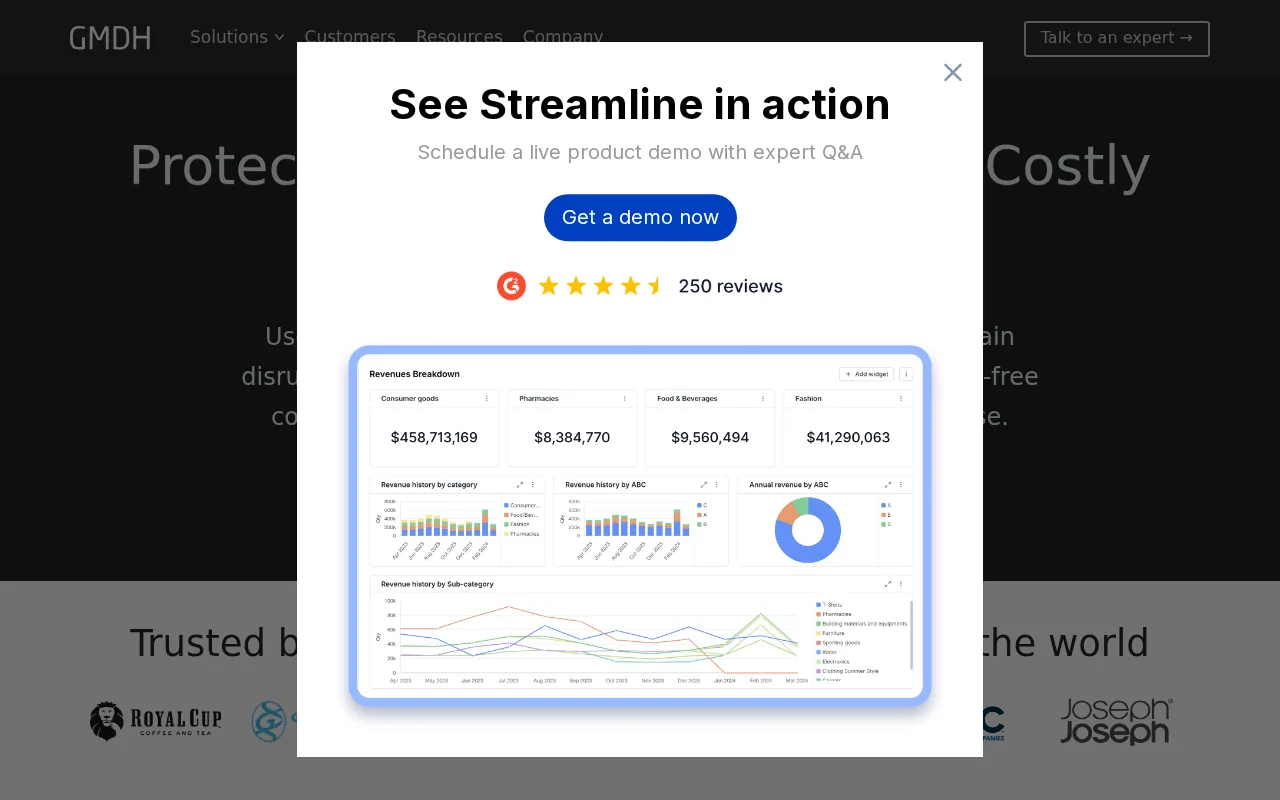
- GMDH Shell is a desktop software that automates time series forecasting using self-organizing algorithms.
- How much does it cost?
- It offers a free plan with basic features and paid subscriptions for advanced capabilities.
- Does it have a free plan?
- Yes, GMDH Shell provides a free plan suitable for individuals with limited data needs.
- What integrations does it support?
- The tool does not offer public APIs or native integrations currently.
- Who is it best for?
- Ideal for analysts and data scientists needing automated forecasting without programming.
| Info | K Score | GMDH Shell |
|---|---|---|
| Pricing | Freemium | Freemium |
| Category | Machine Learning Models & Algorithms | Machine Learning Models & Algorithms |
| Deployment | Cloud | Desktop |
| Learning Curve | Intermediate | Intermediate |
| Free Plan | ✓ | ✓ |
| AI Agent | ✗ | ✗ |
| Autonomy | Assistant | Assistant |
| Risk Tier | Low | Low |
GMDH Shell has an overall score of 5.2/10 and offers a freemium pricing model, focusing primarily on automated machine learning and time series forecasting for business analytics. K Score, with a slightly higher overall score of 5.5/10 and also using a freemium pricing approach, emphasizes predictive analytics and model evaluation with a user-friendly interface suited for data scientists and analysts. While both tools provide accessible entry points through freemium plans, GMDH Shell is more specialized in forecasting applications, whereas K Score offers broader predictive modeling capabilities.
ⓘ How Volvenix scores work
Scores are computed by Volvenix — not supplied by the vendors, and not third-party benchmark results. Each 0–10 dimension (Overall, Features, Usability, Support, Pricing) is a directional estimate aggregated from catalog signals — editorial cataloguing, content depth, engagement, and provider-reputation indicators — so treat them as a starting point, not a lab result.
Confidence reflects how complete the underlying data is for both tools; lower confidence means fewer signals were available, not a worse tool. We never accept payment for rankings or scores. More about how Volvenix works →