Chartbeat vs Contentsquare
AI-enhanced independent comparison — features, pros, cons, pricing and rankings.
| Dimension | Chartbeat | Contentsquare |
|---|---|---|
| Accuracy & Reliability | ||
| Ease of Use | ||
| Features & Capability | ||
| Value for Money | ||
| Performance & Speed | ||
| Popularity & Adoption |
Who each tool serves best — and when to pick the other one.
Editorial teams and media publishers who need real-time audience engagement data to optimize content strategies.
- You need immediate insights on how audiences engage with your content in real time.
- You want to optimize editorial strategies based on detailed engagement metrics.
- Your team requires a platform focused on media publisher analytics and content performance.
Small businesses or individual creators with limited budgets who need free or low-cost analytics solutions.
- You need a free or low-cost analytics tool for small-scale or personal projects.
- Free-tier limits are a blocker for your team’s analytics needs.
- You require extensive third-party integrations beyond media-focused analytics.
Real-time audience engagement and content performance analytics tailored for media publishers.
Marketing and product teams in mid to large enterprises focused on improving user engagement and digital experience optimization.
- You want to deeply understand user journeys and behavior on your digital platforms.
- You need detailed visual analytics like heatmaps and session replays to optimize UX.
- Your team requires enterprise-grade analytics with AI-driven insights for decision-making.
Small businesses or startups with limited budgets or those needing a simple, out-of-the-box analytics solution.
- You need a low-cost or free analytics tool for a small website or app.
- You want a simple, quick setup without extensive customization or training.
- You require a tool with transparent, fixed pricing tiers publicly available.
Depth and quality of user behavior insights and visual analytics capabilities.
A canonical comparison across capabilities common to this category. Vendor-specific extras appear below in "Highlighted Features".
| Capability | Chartbeat | Contentsquare |
|---|---|---|
|
API Access
Programmatic access via documented API
|
✓ | — |
Each tool's marketing-listed features. Where a feature appears under one tool but not the other, it usually reflects how the vendor describes their product — not a definitive capability gap.
- Real-time audience analytics — Tracks live visitor engagement and behavior
- Engaged time measurement — Measures how long users actively engage with content
- Content performance insights — Analyzes which content drives audience retention
- Custom Reporting — Allows tailored reports for editorial teams
- Heatmaps — Visualize user clicks, scrolls, and attention
- Session Replay — Replay user sessions to see exact interactions
- Journey Analysis — Map user paths and drop-off points
- AI Insights — Automated detection of friction and opportunities
- Integrations — Connect with major marketing and analytics tools
- Provides real-time audience engagement data
- Focuses on meaningful metrics like engaged time
- Designed specifically for media publishers
- Helps optimize editorial content strategies
- User-friendly dashboard and reporting
- Detailed visual user behavior analytics
- Strong AI-driven insights for optimization
- Comprehensive journey mapping and heatmaps
- Enterprise-grade data security and compliance
- Scalable for large digital platforms
- No publicly available pricing tiers; enterprise only
- Lacks a free or trial plan for testing
- Limited integrations outside media analytics
- Pricing not publicly available, only enterprise plans
- Complex platform requiring training and onboarding
- No free or trial plans available
- Real-time monitoring of news website traffic
- Optimizing editorial content based on engagement
- Measuring audience retention on media platforms
- Reporting on content performance for stakeholders
- Tracking visitor behavior during live events
- Optimize website user experience
- Improve mobile app engagement
- Identify conversion funnel drop-offs
- Enhance digital marketing campaigns
- Monitor customer journey across channels
No third-party integrations confirmed.
The underlying AI models each tool runs on. Model details show on hover.
No models confirmed.
Natural languages each tool generates and understands. Primary languages are listed first.
What each tool can accept (input) and produce (output) — text, image, audio, video, code.
Regulatory frameworks each tool claims compliance with (HIPAA, SOC 2, GDPR, etc.).
Vendor-published numbers each tool highlights — usage scale, breadth, and operational stats. Different tools track different metrics, so direct row-by-row comparison usually isn't meaningful.
- Real-time Engagement Live audience data
- User Engagement Insights High
Who each tool is positioned for — primary audience first.
How each tool is classified in the Volvenix catalog.
These vocabulary domains are managed in our catalog but not yet exposed at the tool level. We're tracking them for future expansion of this comparison.
- Encryption Types — AES-256, ChaCha20, RSA-2048, and similar at-rest/in-transit cipher families.
- Encryption Contexts — where encryption is applied (data at rest, in transit, end-to-end).
- Plan-tier Model Mapping — which AI models are available on which pricing tier (currently only the model list is tracked, not the per-plan availability).
- What is this tool?
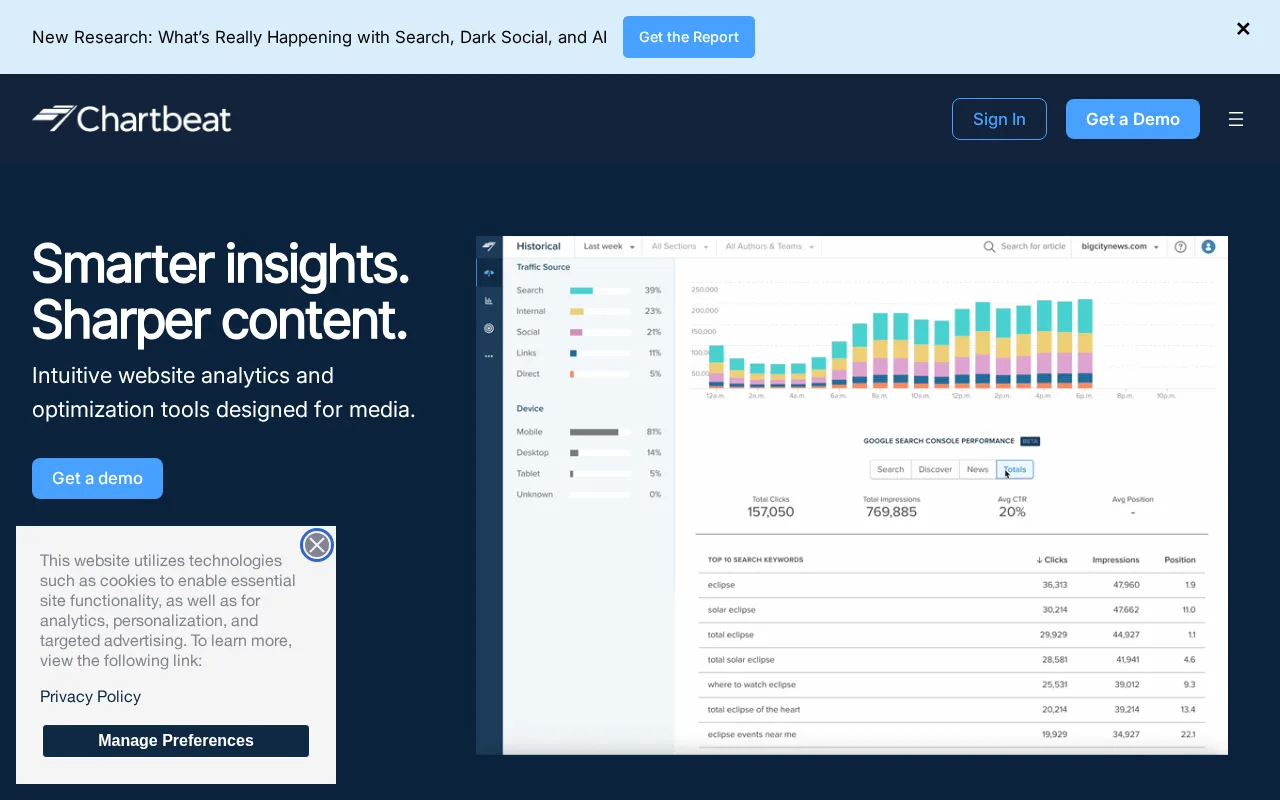
- Chartbeat is a real-time audience analytics platform designed for media publishers to track engagement and content performance.
- How much does it cost?
- Chartbeat uses custom enterprise pricing; you must contact sales for a quote.
- Does it have a free plan?
- No, Chartbeat does not offer a free or trial plan.
- What integrations does it support?
- Chartbeat integrates primarily with media and publishing platforms; detailed integrations are available upon inquiry.
- Who is it best for?
- It is best suited for editorial teams and media publishers needing real-time audience insights.
- What is this tool?
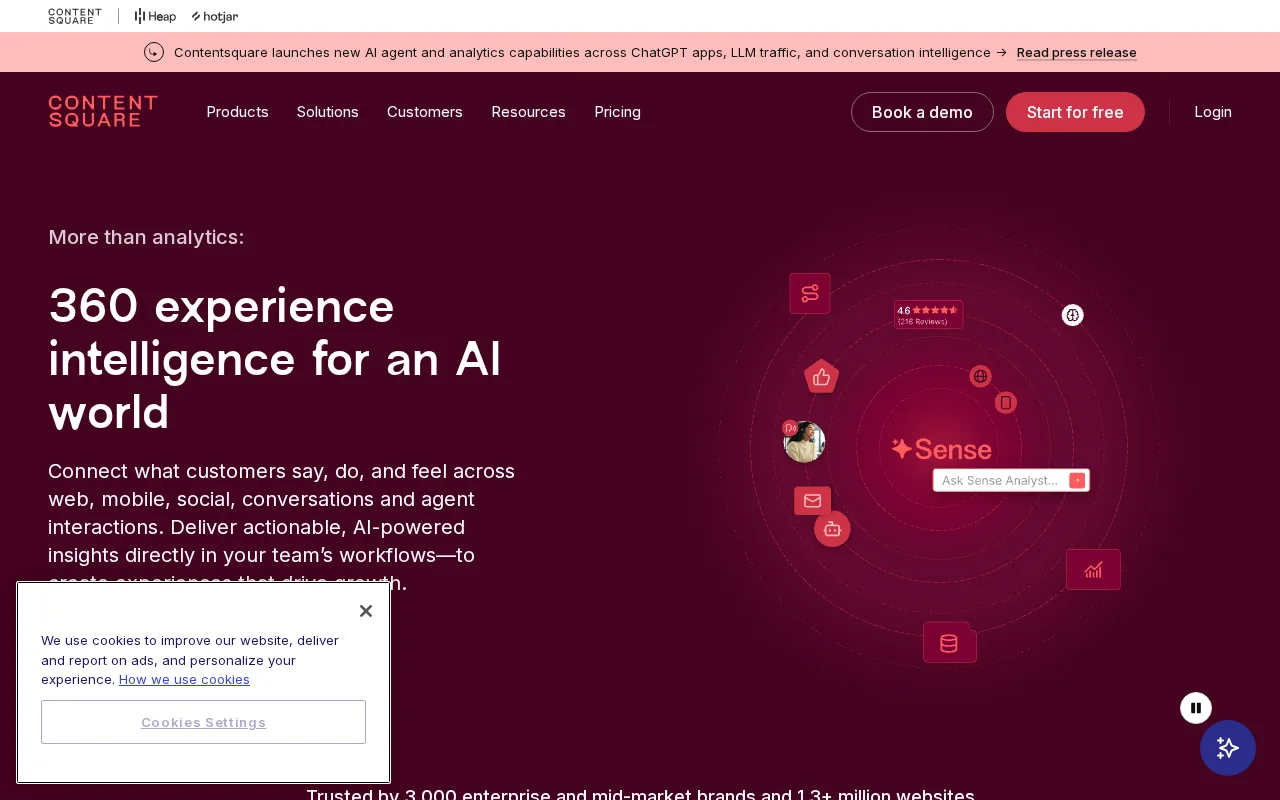
- Contentsquare is a digital experience analytics platform that analyzes user behavior to optimize websites and apps.
- How much does it cost?
- Contentsquare pricing is custom and tailored for enterprise clients; contact sales for details.
- Does it have a free plan?
- No, Contentsquare does not offer a free or trial plan.
- What integrations does it support?
- Contentsquare integrates with major marketing and analytics platforms, though specifics require contacting sales.
- Who is it best for?
- It is best suited for marketing and product teams in mid to large enterprises focused on user engagement.
| Info | Chartbeat | Contentsquare |
|---|---|---|
| Pricing | Enterprise | Enterprise |
| Category | Media, Entertainment & Creator AI | E-Commerce, Retail & Shopping AI |
| Deployment | Cloud | Cloud |
| Learning Curve | Intermediate | Advanced |
| Free Plan | ✗ | ✗ |
| AI Agent | ✗ | ✗ |
| Autonomy | Assistant | Assistant |
| Risk Tier | Low | Low |
Contentsquare and Chartbeat both offer enterprise-level pricing and have similar overall scores, with Contentsquare at 5.3/10 and Chartbeat at 5.2/10. Contentsquare focuses on user experience analytics and behavior tracking to optimize digital customer journeys, while Chartbeat specializes in real-time content performance monitoring and audience engagement for publishers. Their feature sets cater to different use cases: Contentsquare is suited for improving website usability and conversion rates, whereas Chartbeat is designed to help editorial teams maximize content impact and reader retention.
ⓘ How Volvenix scores work
Scores are computed by Volvenix — not supplied by the vendors, and not third-party benchmark results. Each 0–10 dimension (Overall, Features, Usability, Support, Pricing) is a directional estimate aggregated from catalog signals — editorial cataloguing, content depth, engagement, and provider-reputation indicators — so treat them as a starting point, not a lab result.
Confidence reflects how complete the underlying data is for both tools; lower confidence means fewer signals were available, not a worse tool. We never accept payment for rankings or scores. More about how Volvenix works →